How Much Test Coverage Is Enough Before a Product Goes to Field?

How Much Test Coverage Is Enough Before a Product Goes to Field?

Why a headline percentage cannot prove field readiness - and how OEM teams should evaluate residual test risk instead.

Abstract

A PCBA can pass multiple production tests and still contain failure modes that matter in the field. That is why a statement such as “95% test coverage” is not, by itself, a release criterion. The percentage is only meaningful when the fault universe, denominator, detection methods, and remaining blind spots are known. This article presents a risk-based method for deciding whether production test coverage is sufficient: define credible manufacturing defects and required behaviors, map each to the evidence generated by the test strategy, identify overlap and residual gaps, and make an explicit release decision based on the consequence of what can still escape.

Executive Summary

OEM teams frequently ask a simple question before production release: How much test coverage is enough?

There is no universal percentage that answers it. A coverage number can refer to accessible nodes, components, structural fault opportunities, PCOLA/SOQ categories, functional requirements, or an internally defined denominator. Two programs can both claim 95% coverage and provide very different evidence.

The better engineering question is: Which credible failures can still escape, what happens if they do, and is additional test evidence justified?

A useful release review therefore considers four things together: the defined fault or requirement universe, the contribution of each inspection/test method, the residual blind spots after those methods are combined, and the consequence of the remaining risk. This approach does not replace application-specific requirements, qualification, safety testing, or regulatory obligations. It helps OEM and EMS teams determine whether the production test strategy is doing the job it was intended to do.

The Direct Answer: “Enough” Is a Residual-Risk Decision, Not a Universal Percentage

Production test coverage is sufficient when the product’s credible manufacturing defects and selected production-critical behaviors have explicit detection or evidence paths, the remaining blind spots are understood, and the residual risk is acceptable for the product and application.

That is deliberately different from saying that 90%, 95%, 98%, or any other number is “enough.” Without a defined denominator, a percentage cannot tell an OEM what has actually been proven.
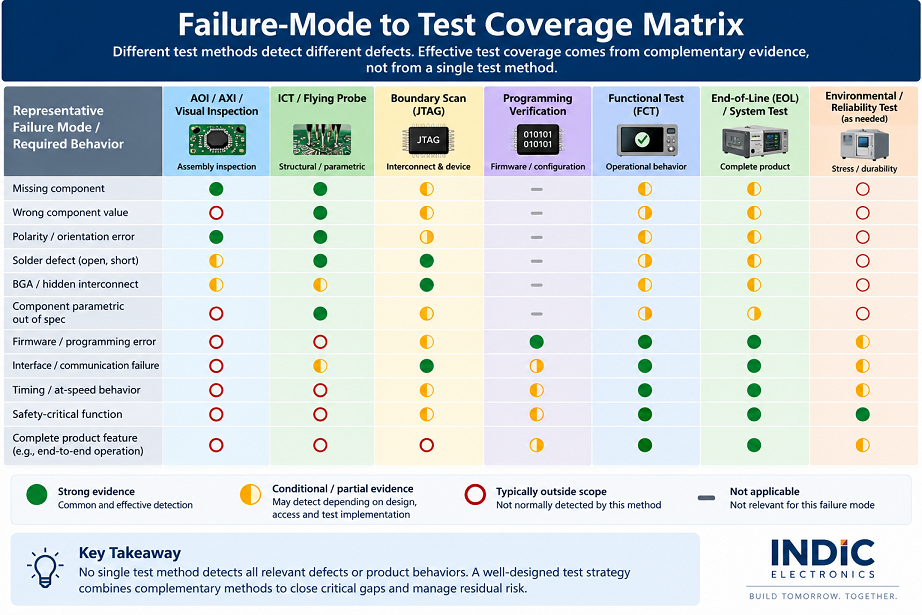
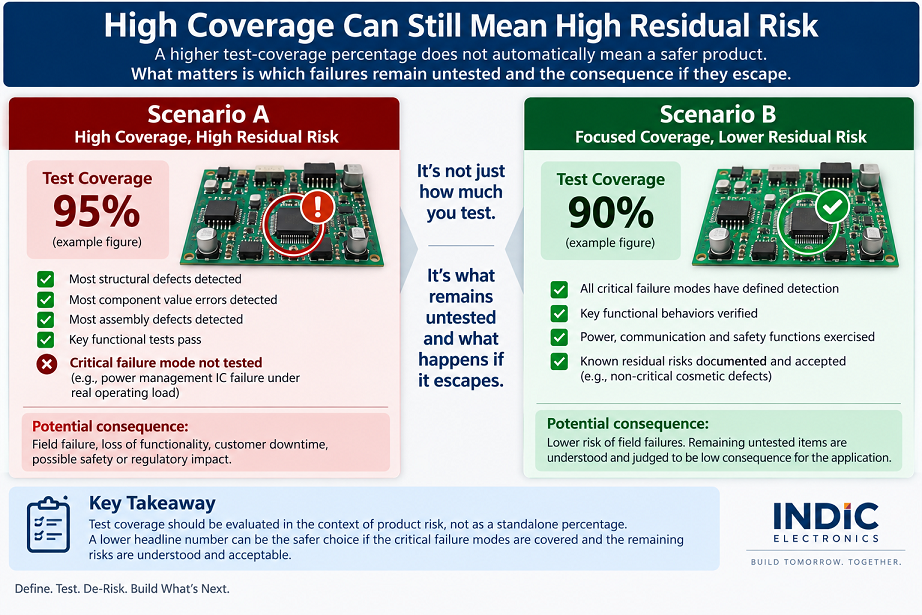
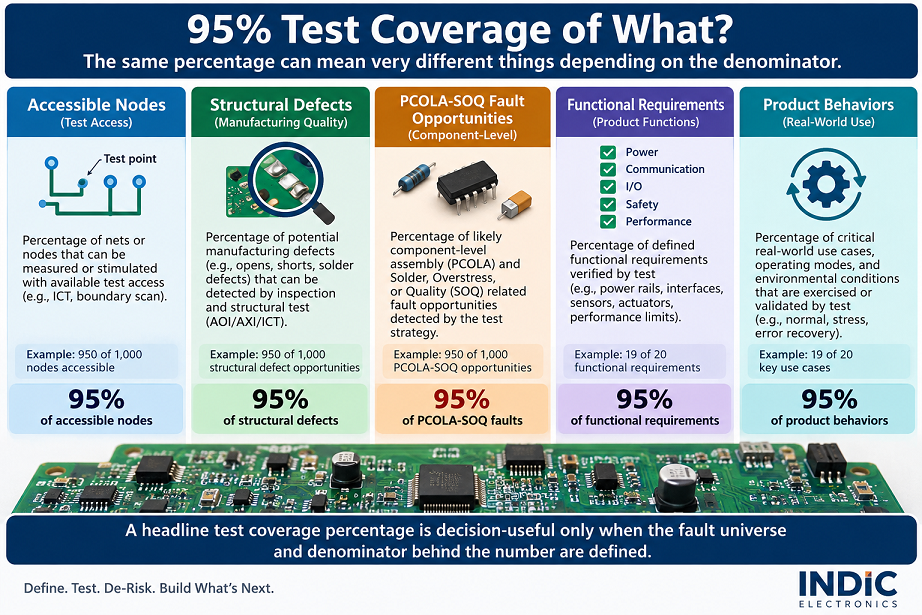
Diagram showing that a headline PCBA test coverage percentage is ambiguous unless its denominator is defined, comparing node access, structural defects, PCOLA-SOQ fault opportunities, functional requirements and product behaviors.
Figure 1. “95% test coverage” is decision-useful only when the fault universe and denominator behind the number are explicit.

Why “95% Test Coverage” Does Not Tell an OEM Enough

A coverage percentage is a ratio. Before an engineering team treats that ratio as evidence, it has to ask: coverage of what?

Depending on the tool or organization, the denominator may be based on testable nodes, components, interconnect opportunities, structural fault categories, or functional requirements. Coverage-analysis tools such as Keysight’s Test Coverage Consultant model coverage against defined fault categories and test strategies rather than treating “coverage” as one universal property of a board. The engineering lesson is straightforward: the denominator controls the interpretation.

For example, a program may have excellent structural coverage of opens, shorts, and component-value faults while providing limited evidence about an at-speed interface, a firmware/configuration mismatch, a load-dependent function, or a product behavior that only appears during final system operation. The structural number may be accurate within its defined model. It is simply not the whole product-release argument.

Decision rule: Never accept a test-coverage percentage until the team can state the fault model or requirement universe that produced it.

Start With the Failure Universe, Not the Test Equipment

A common planning mistake is to start with equipment: “We have AOI, flying probe, ICT and FCT - what coverage does that give us?” A more useful sequence starts with the product.

Identify the failure modes and required behaviors that matter for the released configuration, then ask which station can generate convincing evidence for each one. The list will vary by product, but it commonly spans multiple categories:

  • assembly and workmanship defects such as missing, wrong, reversed or misaligned parts;
  • opens, shorts and interconnect faults;
  • component-value or basic parametric errors;
  • programming, firmware, identity or configuration errors;
  • interface and subsystem behavior that requires active stimulus;
  • product-specific safety or end-of-line checks;
  • behaviors that belong to validation or qualification rather than production test.

This last distinction matters. Production test is not qualification. A production station can verify selected unit-level attributes against released criteria. It does not, by itself, prove environmental durability, lifecycle performance, EMC behavior, vibration resistance, humidity tolerance, or every field operating condition. Those are separate bodies of evidence.

Different Test Methods Produce Different Evidence

There is no single production-test technology that proves every relevant condition. Visual and automated inspection, structural electrical test, boundary scan, programming verification, functional test and end-of-line test answer different questions. IEEE 1149.1 boundary scan, for example, was developed in part to provide standardized test access to board-level interconnects when physical probing becomes difficult.

The right question is not “Which method is best?” It is “What does this method prove that the rest of the strategy does not?”

Evidence Needed Likely Method(s) What It Can Establish Residual Question
Presence, orientation, placement, visible workmanship SPI / AOI / AXI / visual inspection Evidence of selected assembly conditions Does the assembled circuit behave electrically and functionally?
Opens, shorts, accessible values and structural faults ICT / flying probe Electrical evidence against a defined structural fault model Which faults remain inaccessible or outside the structural model?
Interconnect access where physical probing is constrained Boundary scan / JTAG where supported Control and observation of supported digital interconnects and devices What parts of the design are outside the scan chain or require other evidence?
Correct firmware/configuration identity Programming verification / checksum / identity checks Evidence that the released image/configuration was applied Does the programmed product behave correctly under required operating conditions?
Powered subsystem or product behavior FCT / EOL / specialized functional test Behavior against defined production stimuli and limits Which field conditions or qualification stresses are not represented at the station?

Indic's existing technical articles describe its production test and traceability strategy, in-house test engineering, and DFT and test-point planning. This article addresses a different question: how an OEM should judge the combined evidence before release.

Matrix mapping representative PCBA failure modes and required behaviors to inspection, structural test, boundary scan, programming verification, functional test and end-of-line evidence, showing that each method has different strengths and blind spots.
Figure 2. Test methods should be planned as complementary evidence sources, not as interchangeable ways to increase one headline percentage.

When More Test Coverage Adds Very Little

More access, more probes, more stations and more test steps do not automatically create proportionate risk reduction. iNEMI’s Test Strategy Project examined the relationship between physical access, fault coverage and economics, and reported that some ICT probe-removal approaches can reduce probe count significantly with only a small reduction in defect coverage.

The broader engineering lesson is not “remove probes.” It is that test access and useful coverage are not the same thing.

Two test stages may both detect the same short. A downstream functional station may also fail because of that short, but its failure message may be “unit does not boot,” which can be much less useful for isolation. The additional station still has value if it proves important behavior, but counting the same structural fault twice does not necessarily double the protection against field escapes.

Before adding another test step, ask:

  • Which new failure class does it detect?
  • Does it improve fault isolation or debug speed?
  • Does it provide evidence for a product behavior that was previously untested?
  • Does it improve process feedback early enough to prevent repeated defects?
  • What cycle-time, fixture, maintenance and change-control burden does it add?

The Missing Question: What Can Still Escape?

A test strategy becomes release-ready when its blind spots are explicit rather than accidental.

Suppose two products both report 95% coverage. Product A has extensive coverage of low-consequence structural faults but leaves one field-critical configuration condition unverified. Product B has a slightly lower headline percentage, but every high-consequence failure mode has a deliberate detection or evidence path and the remaining gaps are low consequence and consciously accepted.

The second strategy may be the better release decision even though its headline percentage is lower.

Comparison showing two products with similar or lower headline test coverage, where the first leaves a high-consequence failure mode untested while the second covers field-critical risks and documents lower-consequence residual blind spots.
Figure 3. A high coverage percentage can coexist with high residual risk if the uncovered portion contains a field-critical failure mode.

A Practical Test Coverage Sufficiency Review

For OEM/EMS release reviews, the following sequence provides a more defensible decision than a percentage target alone.

1. Define the coverage universe

State what is being counted: a structural fault model, PCOLA/SOQ categories, requirements, functions, or another defined universe. If several models are used, keep them separate rather than combining unlike denominators into one number.

2. Map each material risk to evidence

For each credible defect or production-critical behavior, identify which inspection or test stage should reveal it and what evidence the station actually records.

3. Identify overlap

Determine where multiple stages are detecting the same failure. Overlap can be intentional and valuable, especially when one stage adds better isolation or confirms a downstream function, but the incremental value should be explicit.

4. Identify blind spots

List what remains partially observed, inaccessible, or completely outside the production test strategy.

5. Evaluate escape consequence

Ask what happens if each residual blind spot reaches the customer. High-consequence risks deserve different treatment from low-impact conditions that are easy to detect or service later.

6. Verify achieved coverage, not theoretical coverage

A DFT analysis can predict what should be testable. Release evidence must also confirm what the actual test program, fixture, firmware, limit set and product revision are doing on the floor.

7. Make the residual-risk decision explicit

For every material uncovered condition, choose a disposition: accept the risk, add a test, redesign for test, control the risk elsewhere, or escalate for engineering review.

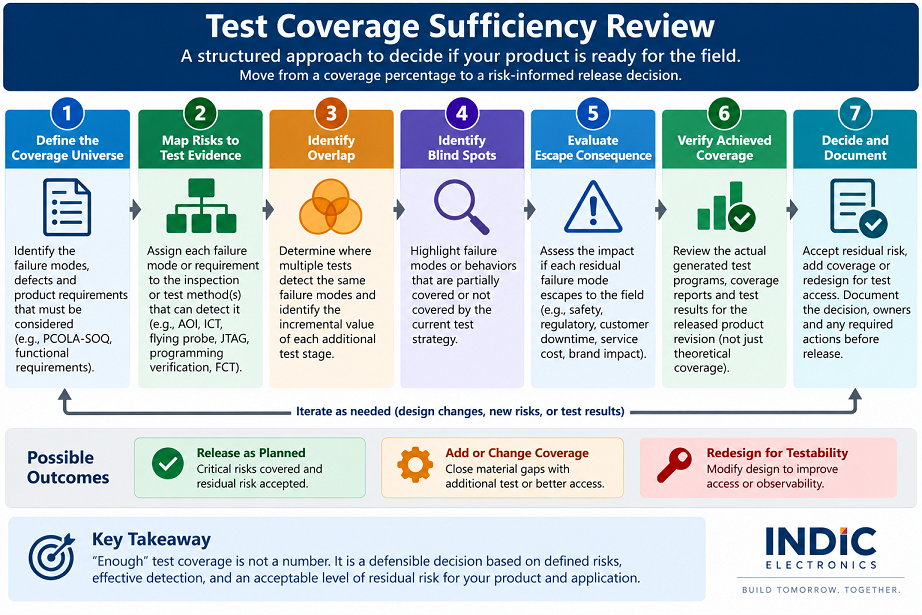
Seven-step flowchart for production test coverage sufficiency: define the fault universe, map risks to evidence, identify overlap, identify blind spots, evaluate escape consequence, verify achieved coverage, and decide whether to accept residual risk or add coverage.
Figure 4. The Test Coverage Sufficiency Review shifts the release question from “What percentage did we reach?” to “What evidence do we have, and what meaningful risk remains?”

Published Indic Example: When the Customer Did Not Supply a Test Specification

Indic has previously published a case involving a complex four-board PCBA for a smart-city lighting application where the customer supplied Gerbers and a BOM but did not provide a dedicated production test specification, and the design offered limited test-point access. The published case describes a staged test approach that ultimately adopted flying probe testing to improve structural evidence.

For this article, the important lesson is not the headline percentage reported in that older case. The decision lesson is that a coverage number only becomes useful after the scope of the test, the faults being considered, and the remaining blind spots are understood. A larger number should never be treated as a universal release target.

Readers who want the original project narrative can review Indic's published flying-probe test coverage case study.

Questions OEM Teams Should Ask Before Approving Test Coverage

  1. What is the denominator? Which faults, nodes, components, requirements or functions are included in the stated coverage?
  2. What important failures are outside that denominator?
  3. Which test stage uniquely detects or isolates each high-consequence failure mode?
  4. Where are we paying for duplicate evidence, and is the duplication intentional?
  5. Which blind spots are accepted, and who owns that acceptance?
  6. Does the actual released test program match the product, firmware, fixture and limit revisions being shipped?
  7. Are we confusing production test with qualification? Field reliability may depend on environmental, safety or lifecycle evidence that belongs outside the manufacturing station.

What “Enough” Actually Means

Enough test coverage does not mean every imaginable failure has been reproduced on the production line. It means the team has built a defensible chain from credible product/manufacturing risks to observable evidence, made the blind spots visible, and consciously decided what to do about the residual risk.

That is a stronger release argument than an arbitrary threshold because it remains useful as the product changes. A layout revision can alter access. A component alternate can change what needs to be measured. Firmware can change the functional evidence required. A new fixture or limit file can change the achieved test result without changing the underlying design. The coverage review should therefore be treated as a controlled engineering artifact, not a one-time percentage.

For OEM teams evaluating an EMS partner, this is also a useful discriminator. The more revealing question is not simply, “What test equipment do you have?” It is, “How do you show what each test proves, what remains untested, and how that evidence stays aligned with product revisions?”

Frequently Asked Questions

What percentage of PCBA test coverage is enough?

There is no universal percentage. The number is meaningful only when the fault model or requirement universe behind it is defined. Sufficiency depends on whether important failure modes have evidence paths and whether residual blind spots are acceptable for the product.

Is 100% test coverage possible?

“100%” can be valid inside a narrowly defined coverage model, but it does not mean every possible product failure, field condition or lifecycle stress has been tested. The scope of the denominator must always travel with the number.

Does functional test replace ICT or flying probe?

Not generically. Structural electrical tests and functional tests generate different evidence. A functional station may reveal that a product does not operate correctly, while an ICT or flying-probe stage may provide faster isolation of an assembly fault. The best mix is product-specific.

How should OEMs measure test coverage?

Define the fault or requirement universe, map each item to a detection method, verify the achieved production program, identify partial or missing coverage, and review the consequence of the remaining gaps.

When should an OEM add another test stage?

Add a stage when it closes a material residual risk, adds meaningful functional evidence, improves diagnostic resolution, or creates process feedback that the existing strategy does not provide. Adding a station only to increase a headline percentage is not a sufficient engineering reason.

Download the Test Coverage Planning Worksheet

Use the editable worksheet to map failure modes to production-test evidence, expose coverage gaps, document overlap and residual risk, assign owners, and create a release-gate record before field deployment.

Download the Test Coverage Planning Worksheet

Gated resource package: B004-Indic_Test_Coverage_Planning_Worksheet.xlsx and printable companion B004-Indic_Test_Coverage_Planning_Worksheet.pdf.

Technical Sources and Further Reading

Indic Test Coverage Planning Worksheet
Indic-Test-Coverage-Planning-Worksheet
Close
After signing up the PDF will be emailed to you at the address you provide.  Please use a company address - gmail, yahoo, outlook, etc. will not be accepted.
Thank you! Your submission has been received!
Oops! Something went wrong while submitting the form.
Join us to stay updated with our latest blog updates, manufacturing and assembly trends, news and announcements!
Thank you! Your submission has been received!
Oops! Something went wrong while submitting the form.